Tuesday, December 24, 2019

Japan guide - bus stop information and bullet train pass


Bus Stop

This is how a bus stop would look like in Japan. Each bus stop has a number and a name. In this case, it is bus stop number 3 called Shijo Omiya.


All the bus numbers making the stop will be displayed in the bus stop information. Below is an example of the bus stop information displayed for bus stop number 3. It is called the Shijo Omiya bus stop. Bus number 18, 32,58,71,6,206 and 207 will stop at this station. The destination of each bus number is also listed. For example, bus 18 will head for Toji Temple, and  bus 6 will head to the Kyoto Station.

The schedule of each bus will also be displayed at the bus stop.
Below is an example of the time table for bus number 206. The hours are listed vertically and the minutes in the hour are listed horizontally. For bus 206, there are three different time schedules listed in three different columns: Weekdays, Saturdays, and Sundays/Holidays.
One Saturday, the first stop will be at 5:56 AM. At 6AM, there will be three stops at 6:27 AM, 6:38 AM and  6:50 AM.


Sometimes the hours displayed are listed in a different format. Below is an example of a JR bus time table. The information tells you when the bus will arrive at this station. Notice the hours are listed horizontally (not vertically like the one above) and the minutes within the hour are listed vertically. For example, the red row lists the hours from 6AM to 10PM (22). There is no stop at 6AM. The first stop in the morning will be at 7:17AM. The second stop will be at 8:08AM. At 9AM, there will be three stops at 9:02AM, 9:17AM and 9:47AM.


Japan Rail Pass


To travel across cities, you will probably need to buy a bullet train pass or the Shinkansen bullet train pass. You will have to specify how many days you want when you buy the pass. It is recommended that you buy the pass before you head to Japan. With this pass, you can reserve for the train ticket to the destination you want. Below is an example of how the pass would look like. It is also called the JR pass. This pass will also allow you to use the JR bus lines wherever they are available.


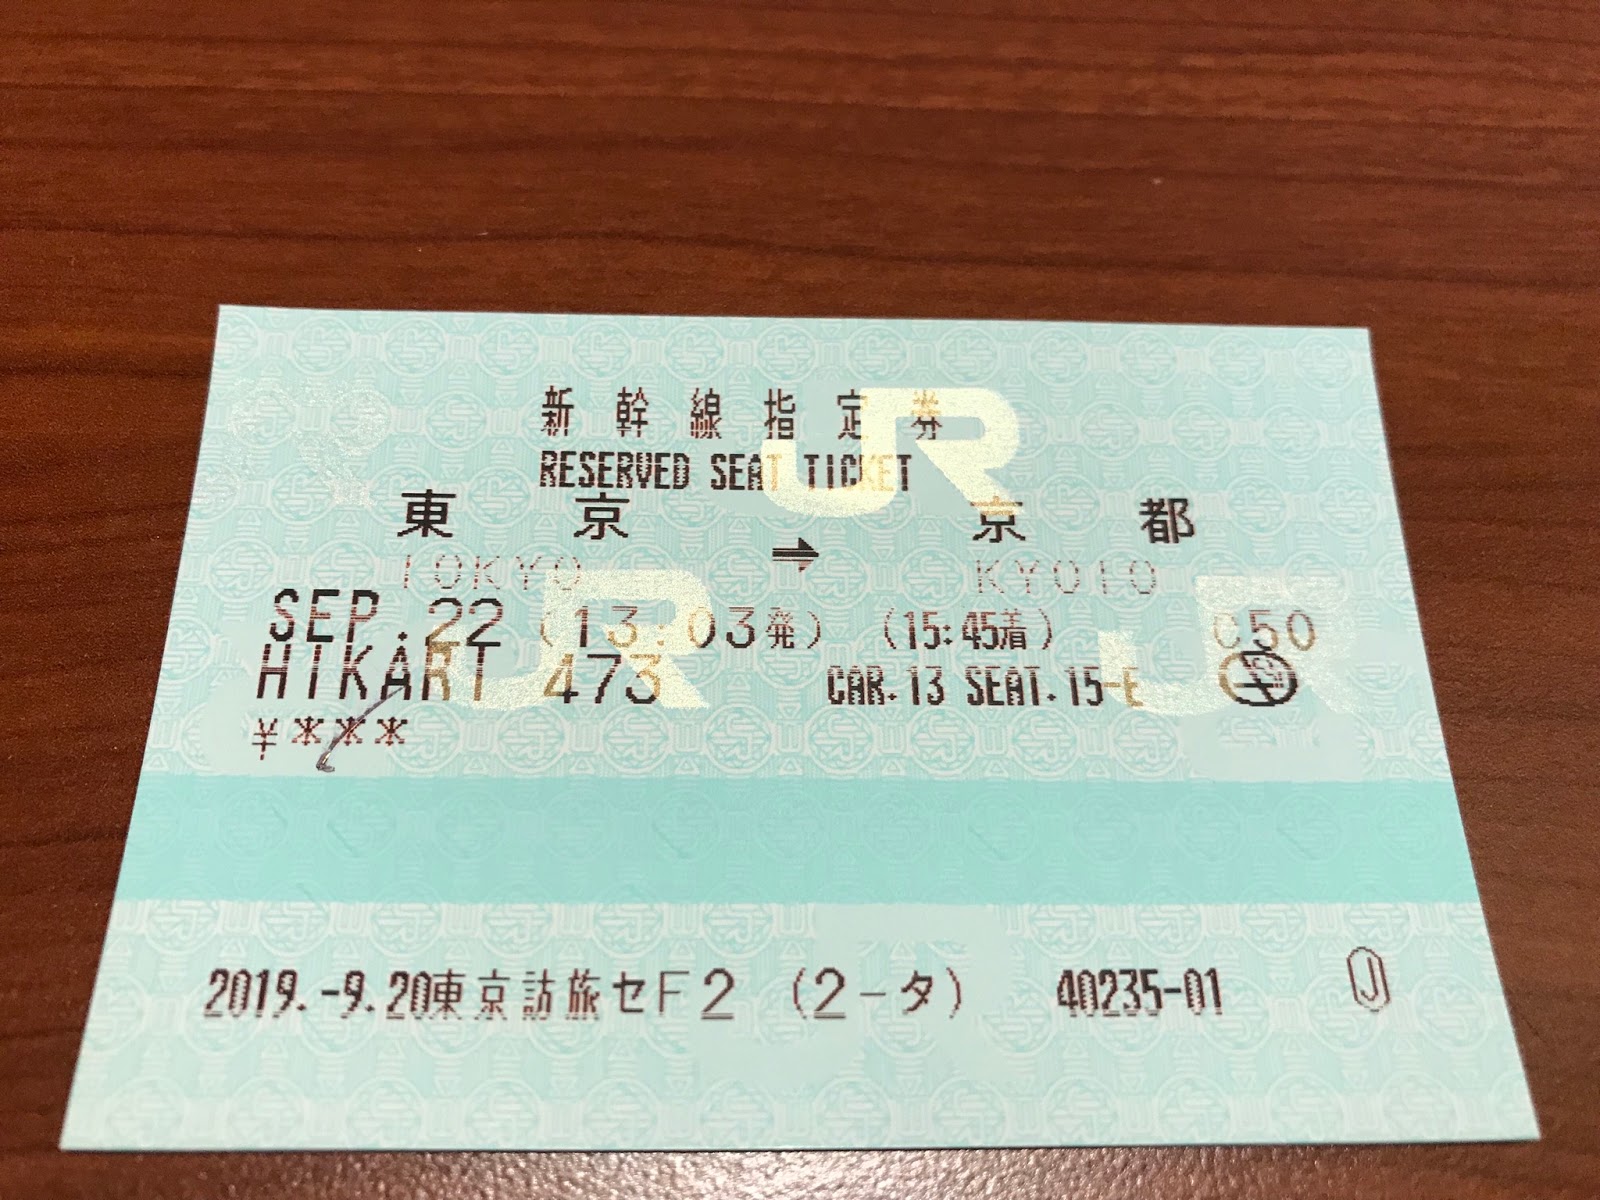
Once you reserve a seat using your Shinkasen/JR pass, you will get a train ticket for your reservation. To make the reservation, you will have to go to the JR office which can be found in any major train stations. Below is an example of a reserved ticket. This ticket says the train will go from Tokyo to Kyoto on September 22nd at 13.03 or 1PM and arrive at Kyoto at 15.45 or 3:45 PM. The train is Hikart 473. Once you are on the train platform, you should head to cart number 13 and your seat number is 15-E.


Japan Travel App


If you plan to use the bus and train a lot while in Japan, you should download this Japan travel app in IOS. With this app you can plug in your current and destination locations, and it will list all the routes you can take to get to your destination. Each route will give you information about what bus number to take at which bus station, what bus station to get off/hop on next, time the bus will depart or arrive and etc. Another big bonus is if you have a JR pass, it will also tell you what route to take to use only the JR pass to get to your destination without paying anything extra.


Saturday, November 16, 2019

LLDB Debugger commands

https://gist.github.com/wanyakun/314690093ea195d749fca6869ebf200e#file-lldb-debugger-commands-txt
Debugger commands:

  apropos           -- List debugger commands related to a word or subject.
  breakpoint        -- Commands for operating on breakpoints (see 'help b' for
                       shorthand.)
  bugreport         -- Commands for creating domain-specific bug reports.
  command           -- Commands for managing custom LLDB commands.
  disassemble       -- Disassemble specified instructions in the current
                       target.  Defaults to the current function for the
                       current thread and stack frame.
  expression        -- Evaluate an expression on the current thread.  Displays
                       any returned value with LLDB's default formatting.
  frame             -- Commands for selecting and examing the current thread's
                       stack frames.
  gdb-remote        -- Connect to a process via remote GDB server.  If no host
                       is specifed, localhost is assumed.
  gui               -- Switch into the curses based GUI mode.
  help              -- Show a list of all debugger commands, or give details
                       about a specific command.
  kdp-remote        -- Connect to a process via remote KDP server.  If no UDP
                       port is specified, port 41139 is assumed.
  language          -- Commands specific to a source language.
  log               -- Commands controlling LLDB internal logging.
  memory            -- Commands for operating on memory in the current target
                       process.
  platform          -- Commands to manage and create platforms.
  plugin            -- Commands for managing LLDB plugins.
  process           -- Commands for interacting with processes on the current
                       platform.
  quit              -- Quit the LLDB debugger.
  register          -- Commands to access registers for the current thread and
                       stack frame.
  script            -- Invoke the script interpreter with provided code and
                       display any results.  Start the interactive interpreter
                       if no code is supplied.
  settings          -- Commands for managing LLDB settings.
  source            -- Commands for examining source code described by debug
                       information for the current target process.
  target            -- Commands for operating on debugger targets.
  thread            -- Commands for operating on one or more threads in the
                       current process.
  type              -- Commands for operating on the type system.
  version           -- Show the LLDB debugger version.
  watchpoint        -- Commands for operating on watchpoints.

Current command abbreviations (type 'help command alias' for more info):

  add-dsym  -- ('target symbols add')  Add a debug symbol file to one of the
               target's current modules by specifying a path to a debug symbols
               file, or using the options to specify a module to download
               symbols for.
  attach    -- ('_regexp-attach')  Attach to process by ID or name.
  b         -- ('_regexp-break')  Set a breakpoint using one of several
               shorthand formats.
  bt        -- ('_regexp-bt')  Show the current thread's call stack.  Any
               numeric argument displays at most that many frames.  The
               argument 'all' displays all threads.
  c         -- ('process continue')  Continue execution of all threads in the
               current process.
  call      -- ('expression --')  Evaluate an expression on the current thread.
               Displays any returned value with LLDB's default formatting.
  continue  -- ('process continue')  Continue execution of all threads in the
               current process.
  detach    -- ('process detach')  Detach from the current target process.
  di        -- ('disassemble')  Disassemble specified instructions in the
               current target.  Defaults to the current function for the
               current thread and stack frame.
  dis       -- ('disassemble')  Disassemble specified instructions in the
               current target.  Defaults to the current function for the
               current thread and stack frame.
  display   -- ('_regexp-display')  Evaluate an expression at every stop (see
               'help target stop-hook'.)
  down      -- ('_regexp-down')  Select a newer stack frame.  Defaults to
               moving one frame, a numeric argument can specify an arbitrary
               number.
  env       -- ('_regexp-env')  Shorthand for viewing and setting environment
               variables.
  exit      -- ('quit')  Quit the LLDB debugger.
  f         -- ('frame select')  Select the current stack frame by index from
               within the current thread (see 'thread backtrace'.)
  file      -- ('target create')  Create a target using the argument as the
               main executable.
  finish    -- ('thread step-out')  Finish executing the current stack frame
               and stop after returning.  Defaults to current thread unless
               specified.
  image     -- ('target modules')  Commands for accessing information for one
               or more target modules.
  j         -- ('_regexp-jump')  Set the program counter to a new address.
  jump      -- ('_regexp-jump')  Set the program counter to a new address.
  kill      -- ('process kill')  Terminate the current target process.
  l         -- ('_regexp-list')  List relevant source code using one of several
               shorthand formats.
  list      -- ('_regexp-list')  List relevant source code using one of several
               shorthand formats.
  n         -- ('thread step-over')  Source level single step, stepping over
               calls.  Defaults to current thread unless specified.
  next      -- ('thread step-over')  Source level single step, stepping over
               calls.  Defaults to current thread unless specified.
  nexti     -- ('thread step-inst-over')  Instruction level single step,
               stepping over calls.  Defaults to current thread unless
               specified.
  ni        -- ('thread step-inst-over')  Instruction level single step,
               stepping over calls.  Defaults to current thread unless
               specified.
  p         -- ('expression --')  Evaluate an expression on the current thread.
               Displays any returned value with LLDB's default formatting.
  parray    -- ('expression -Z %1   --')  Evaluate an expression on the current
               thread.  Displays any returned value with LLDB's default
               formatting.
  po        -- Evaluate an expression on the current thread.  Displays any
               returned value with formatting controlled by the type's author.
  poarray   -- ('expression -O -Z %1    --')  Evaluate an expression on the
               current thread.  Displays any returned value with LLDB's default
               formatting.
  print     -- ('expression --')  Evaluate an expression on the current thread.
               Displays any returned value with LLDB's default formatting.
  q         -- ('quit')  Quit the LLDB debugger.
  r         -- ('process launch -X true --')  Launch the executable in the
               debugger.
  rbreak    -- ('breakpoint set -r %1')  Sets a breakpoint or set of
               breakpoints in the executable.
  repl      -- ('expression -r  -- ')  Evaluate an expression on the current
               thread.  Displays any returned value with LLDB's default
               formatting.
  run       -- ('process launch -X true --')  Launch the executable in the
               debugger.
  s         -- ('thread step-in')  Source level single step, stepping into
               calls.  Defaults to current thread unless specified.
  si        -- ('thread step-inst')  Instruction level single step, stepping
               into calls.  Defaults to current thread unless specified.
  sif       -- Step through the current block, stopping if you step directly
               into a function whose name matches the TargetFunctionName.
  step      -- ('thread step-in')  Source level single step, stepping into
               calls.  Defaults to current thread unless specified.
  stepi     -- ('thread step-inst')  Instruction level single step, stepping
               into calls.  Defaults to current thread unless specified.
  t         -- ('thread select')  Change the currently selected thread.
  tbreak    -- ('_regexp-tbreak')  Set a one-shot breakpoint using one of
               several shorthand formats.
  undisplay -- ('_regexp-undisplay')  Stop displaying expression at every stop
               (specified by stop-hook index.)
  up        -- ('_regexp-up')  Select an older stack frame.  Defaults to moving
               one frame, a numeric argument can specify an arbitrary number.
  x         -- ('memory read')  Read from the memory of the current target
               process.

For more information on any command, type 'help <command-name>'
Examples: >lldb program.app //load the program at the command line Inside lldb >file program.app //load the program >b list //list all breakpoints >b main >b main.cpp:12 >b classname::method name >br delete 1. //delete the first breakpoint >br delete //delete all breakpoints >run >n >print [var name] >fr v //print all variables >apropos path //list all commands that have the word path in it or in its description Debugging with a debug image or dmg file open the dmg file and copy the app file to a folder A get the sha number related to the version of the app and create a branch from that sha number >git checkout sha-number branchApp >run the app >run Xcode and attach to the app >select debug->pause to pause the execution so you can access the lldb console >now you can set a breakpoint in the console. >br classname::method

Remote Debugging on MAC 


Start the debug server on the target Mac machine: 

/Applications/Xcode.app/Contents/SharedFrameworks/LLDB.framework/Versions/A/Resources/debugserver dev_machine_ip:portnumber  


  1. /Applications/Xcode.app/Contents/SharedFrameworks/LLDB.framework/Versions/A/Resources/debugserver 10.0.46.83:16000  


  1. On the dev machine, use lldb to connect to the debugserver: 

>lldb 

(lldb) process connect connect://10.0.46.241:16000 

(lldb) process attach --name 'Adobe Premiere Pro (Beta)' --waitfor  //this tells the debugserver to wait and attach to process name adobe premiere. 


  1. Run adobe premiere on the target machine


GDB to LLDB command map

Tuesday, June 11, 2019

Windows PE and PDB file format

PE = Program executable
PDB = program database. This file contains information such as symbols information to help troubleshoot the PE file.

windbg (windows debugger) matches the PE file with the PDB file by using a signature that is unique. This signature information is generated by the linker.
The signature is made up of the timestamp  + the pdb age in the older version of pdb format.
In the newer version of the pdb (version 7), the signature is made of the guid  + the pdb age.
guid is much more unique than the timestamp. The pdb age is a integer that gets incremented every time the pdb gets changed.

Useful tools to help display information about the PE file format:
PE Studio   https://www.winitor.com/


PE View     http://wjradburn.com/software/

Here is a tutorial on how to check the debug type of a PE file using the PE view program.
In figure 1, a DLL file is opened using the PE view program. We want to know what is the debug type of the DLL file. For more information about debug type, please check the MSFT link below.
To see where is the debug type information is stored in the file, we first need to check the image optional header (2). Since the DLL file is compiled with debug information, we should see debug directory information in the image optional header (3). The file offset containing the debug directory information is at offset 000001D8 and it has a RVA value of 03756260. The debug directory size is 54.
 Figure 1.

Expand the .rdata section in Figure 2, we see that the image_debug_directory section is starting at RVA 03756260. This is the same RVA value as shown in Figure 1.

Figure 2.

If we change the view from RVA to view offset (1) in Figure3, we will see that each section will start at 0x0 (2) instead of at 03756260 as in Figure 1. In the offset view, the debug type value can be read at offset 0xC, and its value is set to 2, IMAGE_DEBUG_TYPE_CODEVIEW (3). The view offset can be handy if you don't want to remember or deal with the complicate offset values displayed in the file offset or RVA view. You can just move file cursor to the beginning of a section using the file offset value and read x number of bytes as the size of the debug directory indicated in Figure 1. Once you read the whole section into an array, you can start reading each field in the section using the offset value shown in the  view offset. For example, the value of the Pointer to Raw Data field can be read using offset 0x18.

Figure 3.

As illustrated in Figure 3, we can continue to move to the file cursor using the file offset value from the "Pointer to Raw Data" field. This will allow us to read the IMAGE_DEBUG_TYPE_CODEVIEW section which contains more information about the pdb file format. In figure 4, the file offset for IMAGE_DEBUG_TYPE_CODEVIEW is the same as the value for "Pointer to Raw Data" field in figure 3.

Figure 4.

Please check the MSFT PE format documentation to see information about the fields included in a section (1). In this case, the PE signature value for this DLL file is RSDS (2) indicating that the PDB 7.0 version file format.

Excellent links to more information:
http://www.debuginfo.com/articles/debuginfomatch.html  -- excellent article
http://www.debuginfo.com/articles/gendebuginfo.html
http://www.godevtool.com/Other/pdb.htm  -- understanding the format of PDB file
http://bytepointer.com/resources/pecoff_v4.1.htm
https://docs.microsoft.com/en-us/windows/desktop/debug/pe-format#optional-header-image-only  -- MSFT documentation of PE file format.

Monday, June 10, 2019

4G LTE USB Dongle


If you want to give your laptop/computer access to the internet via 4G LTE signal, you should consider this device:

Modem Huawei E3372-510 Unlocked 4G LTE USB Dongle


With this device you can access the internet anywhere where the cell phone signals are available. Unlike WIFI signals, 4G LTE signal can provide internet in many more places. This device is very handy if you cannot do a WiFi hotspot from your phone because your data plan does not allow you to do that.

There are a few things that you need to do to get this device to work properly with the AT&T network:
First, you need to know how to install the AT&T sim card to the device: 

If you have a nano sim card, you may need to buy a nano adapter to help make the nano sim card sits securely inside the sim card slot. Some nano adapters are not so well designed that the nano sim card will fall out of the adapter every time you try to push the nano adapter, with the gold plated side facing down, into the sim card slot. The trick to resolving this issue is to turn everything upside down including the device so nano sim card won't fall out of the adapter when you push the nano adapter into sim card slot. 

Second, once you have access to the Huawei home page, you need to add a profile to be able to access the AT&T network properly (tip from an Amazon review):

- Connect your stick to your computer.
- Wait for your computer to get a local IP address 192.168.0.???
- Open a web browser and go to 192.168.0.1 the built in Huawei web portal for the device
- You should see signal bars but "Disconnected"
- Go to Settings -> Dial-Up -> Profile Management
- Create a new profile, name it whatever, use whatever username and password you want
- HERE IS THE KEY - APN, for AT&T just type in "broadband"
- Click Save/Apply


How does it feel to be able to work remotely from a white sand beach? :)

Monday, April 15, 2019

How to tell where and what files a windows program is trying to open?

Have you ever tried to wonder what files a windows program is trying to open behind the scene?

There are many reasons why people would want to know this information, but for development
these information are very useful not only for troubleshooting but also fixing the program from not running correctly.

 Below is a screenshot showing you  what the Admintool program is trying to read. In this example, process monitor says that Admintool.exe was trying to read a file called tnsnames.ora. It even tells you the path the program is expecting the file to be located. So if you were to put the file in the wrong location, the reading would fail. Besides telling the files, process monitor also tells you the followings:

1. registry keys the program tries to read.
2. dll files the application is trying to load including their paths as well.
3. TCP message that the application tries to send and the destination

After you installed process monitor, you can tell it to include events from your program only by using the "Include Process From Window" button.  This button has a shooting target icon.