Debug with WinDBG:
1. first make sure that a crash dump *.dmp file is created for the crash.You can check this by going to the computer property dialog.
2. know the location of the crash dump file so that you can load it in winDBG.
3. refer to the manual no how to read information from the crash dump file.
Basically execute the command >!analyze -V in Windbg and locate the library where the crash is occurring and the reason for the crash or the type of crash ( null pointer access, and etc). This is good information because it gives you an idea on where you should start looking for the code causing the crash. It helps narrow down the search.
If your windbg cannot proceed further due to symbols cannot be found or anything related to missing symbols, make sure you include the path to the symbol files. Check the manual for more information on this.
Make sure you save the session so that this information is saved for the next session.
Documentation on all the commands: https://docs.microsoft.com/en-us/windows-hardware/drivers/debugger/lm--list-loaded-modules-
Here are common commands that you can use in windbg to troubleshoot better:
>!sym noisy //turn on noisy mode. This will allow you to see what requests the debugger send to the symbol server or where it tries to load the symbols when you open up a dump file.
>.restart /f //restart everything
>bc * //create all breakpoints
>g //run
>bp @@(class:methodA) //set a breakpoint at methodA
>dt -b TypeName; -display the layout of the data type TypeName, -b enable recursive display.
>dt -b CSymbolInfoPackage;q
>dt -b TypeName Address -layout of a particular variable. Notice this will display the values of the
structures' member variables as well.
>dt -b CSymbolInfoPackage 0x234234;q //notice the address end with ;q
>!sympath // to see all paths windbg used to search for symbol files
>!sympath srv*c:\symbols*http://symbolserver/sym //add new symbol server pdb
>!exepath srv*c:\symbols*http://symbolserver/sym //add new symbol server for exe
>!srcpath srv*c:\p4src //add path for source code
>kb //stack back trace for current running thread
>~*kb // stack back trace for all threads
>lm //show modules being loaded
>lmv //show modules being loaded and information about them.
>lmDvmnvlddmkm //display information about the module nvlddmkm, v = verbose, D = display output using debugger markup language. m=pattern that the module name must match, in this case nvlddmkm
>lmv m moduleName //print record of the moduleName including its name, timestamp, image size and location of the pdb file if it is found.
>lmv m dva* //print all module having dva*
>!lmi moduleName //print the moduleName's header information assuming that the module is loaded already
Example:
: kd> !lmi nvlddmkm
Loaded Module Info: [nvlddmkm]
Module: nvlddmkm
Base Address: fffff80e97690000
Image Name: nvlddmkm.sys
Machine Type: 34404 (X64)
Time Stamp: 5c7dcd42 Mon Mar 4 17:13:38 2019
Size: 14ff000
CheckSum: 149c79c
Characteristics: 22
Debug Data Dirs: Type Size VA Pointer
CODEVIEW 88, 8180d8, 815ad8 RSDS - GUID: {92644F26-333B-4C11-9CEB-B8B49D806B87}
Age: 1, Pdb: C:\dvs\p4\build\sw\rel\gpu_drv\r421\r421_00\drivers\display\lddm\nvlddmkm\_out\wddm2_amd64_release\nvlddmkm.pdb
VC_FEATURE 14, 818160, 815b60 [Data not mapped]
POGO 38c, 818174, 815b74 [Data not mapped]
Image Type: MEMORY - Image read successfully from loaded memory.
Symbol Type: NONE - PDB not found from symbol server.
Load Report: no symbols loaded
>.hh command // to get help on a command such as .hh .symopt
When you see windbg complains about not being able to load symbol files for certain dll files, (but you know for sure that the files are there in the symbol paths) There can only be a few reasons for this. One reason for this is the timestamp for these files are different from the one used during the creation of the dump file.
You can force windbg to load these symbol files by issuing this command
>.symopt+0x40 //this will tell windbg to load
> X module!symbol - find the address of the symbol in the module
>x myapp!*CMainFrame* // list all member functions and static data members of CMainFrame class define in myapp. you can get the address of the symbols from the output.
>ln Address //find the symbol by address
For other commands check the manual for WinDBG
devenv /debugexe program.exe --- launch the program to debug. This is better than attaching to a process because sometimes it is too late to see the issue when you try to attach to the process. For example, if the process crashes right the way, then you cannot attach to it. You may need to specify the full path to the program in order for Visual Studio to locate the program.
Launching the program this way allows to you see what files get loaded. You can check the output console for errors like missing symbol files ( *.pdb) and know the path where Visual Studio (VS) is looking for these files. If VS cannot load the symbol file for a particular library, then you can step through the code in that library. From the output console, u can also right click on the library and specified the path to the symbol file as well but this will take vs sometime to load and update. It is best that you stop the session and copy the symbol files to the path VS is expecting and restart the debug session again. Notice the output console can give you valuable information. This information is similar to the information you would get from running the dependency walker program but it is more readable. What is good about this is the errors are
shown next to the questioned library files. With Dependency Walker you have to rely on the icons representing errors. If a library cannot be loaded or missing, you can tell right the way from the console where VS is looking for that library.
To set a break point, press ctrl+b and type in the method name or class::method to set a breakpoint at that method.
If you want to debug with a release build, run this command in the console first before running the devenv ... command:
set _NT_SYMBOL_PATH=SRV*c:\symbols\analytics*\\sdcnas05.siebel.com\anabuild\share\gasymsrv;SRV*c:\symbols\analytics*\\sdcnas06.siebel.com\ANABUILD\share
\gasymsrv;SRV*c:\symbols\analytics*\\sdcnas06.siebel.com\ANABUILD\share\symsrv;SRV*c:\symbols\winnt*http://msdl.microsoft.com/download/symbols
This will setup the symbol paths.
https://referencesource.microsoft.com/ -- contains source code
>symchk.exe /od /ob /op /oe /os /v /s "srv*c:\symbols*http://localhost/sym" "AppSensor.dll"
## /s specify the local directory and the symbol server address
[SYMCHK] Searching for symbols to c:\dispsym_local_cache\bugs\AppSensor\AppSensor.dll in path srv*c:\symbols*http://localhost/sym
DBGHELP: Symbol Search Path: srv*c:\symbols*http://localhost/sym
[SYMCHK] Using search path "srv*c:\symbols*http://localhost/sym"
DBGHELP: No header for c:\dispsym_local_cache\bugs\AppSensor\AppSensor.dll. Searching for image on disk
DBGHELP: c:\dispsym_local_cache\bugs\AppSensor\AppSensor.dll - OK
SYMSRV: BYINDEX: 0x1
c:\symbols*http://localhost/sym
AppSensor.pdb
3754687F7111426692C7E697A47D734C1
SYMSRV: UNC: c:\symbols\AppSensor.pdb\3754687F7111426692C7E697A47D734C1\AppSensor.pdb - path not found
SYMSRV: UNC: c:\symbols\AppSensor.pdb\3754687F7111426692C7E697A47D734C1\AppSensor.pd_ - path not found
SYMSRV: UNC: c:\symbols\AppSensor.pdb\3754687F7111426692C7E697A47D734C1\file.ptr - path not found
SYMSRV: HTTPGET: /sym/index2.txt
SYMSRV: HttpQueryInfo: 80190194 - HTTP_STATUS_NOT_FOUND
SYMSRV: HTTPGET: /sym/AppSensor.pdb/3754687F7111426692C7E697A47D734C1/AppSensor.pdb
###First, it tries to download the non compressed version of the file. The actually request or URL used
#is http://localhost/sym/AppSensor.pdb/3754687F7111426692C7E697A47D734C1/AppSensor.pdb
SYMSRV: HttpQueryInfo: 80190194 - HTTP_STATUS_NOT_FOUND
SYMSRV: HTTPGET: /sym/AppSensor.pdb/3754687F7111426692C7E697A47D734C1/AppSensor.pd_
###Second, if the first request does not work, it will try to download the compress version for the file ending with underscore.
###AppSensor.pd_
SYMSRV: HttpQueryInfo: 801900c8 - HTTP_STATUS_OK
SYMSRV: AppSensor.pdb from http://localhost/sym: 2883718 bytes copied
SYMSRV: PATH: c:\symbols\AppSensor.pdb\3754687F7111426692C7E697A47D734C1\AppSensor.pdb
###Here the file is downloaded and store at this local path.
SYMSRV: RESULT: 0x00000000
DBGHELP: AppSensor - private symbols & lines
c:\symbols\AppSensor.pdb\3754687F7111426692C7E697A47D734C1\AppSensor.pdb
###All of the info below is debug information about the image Appsensor.dll
[SYMCHK] MODULE64 Info ----------------------
[SYMCHK] Struct size: 1680 bytes
[SYMCHK] Base: 0x180000000
[SYMCHK] Image size: 2301952 bytes
[SYMCHK] Date: 0x5d013f8e
[SYMCHK] Checksum: 0x002346b1
[SYMCHK] NumSyms: 0
[SYMCHK] SymType: SymPDB
[SYMCHK] ModName: AppSensor
[SYMCHK] ImageName: c:\dispsym_local_cache\bugs\AppSensor\AppSensor.dll
[SYMCHK] LoadedImage: c:\dispsym_local_cache\bugs\AppSensor\AppSensor.dll
###Below is the PDB section information. CV stands for code view. CV=RSDS indicates it's a
### PDB 7.0 file format.
[SYMCHK] PDB: "c:\symbols\AppSensor.pdb\3754687F7111426692C7E697A47D734C1\AppSensor.pdb"
[SYMCHK] CV: RSDS
[SYMCHK] CV DWORD: 0x53445352
[SYMCHK] CV Data: C:\dvs\p4\build\sw\gcomp\dev\src\Mjolnir\Features\AppSensor\plugin\_out\win7_amd64_release\AppSensor.pdb
[SYMCHK] PDB Sig: 0
[SYMCHK] PDB7 Sig: {3754687F-7111-4266-92C7-E697A47D734C}
[SYMCHK] Age: 1
###Notice the signature of the PDB file + its age formed part of the URL mentioned earlier
###3754687F-7111-4266-92C7-E697A47D734C + 1
[SYMCHK] PDB Matched: TRUE
[SYMCHK] DBG Matched: TRUE
[SYMCHK] Line nubmers: TRUE
[SYMCHK] Global syms: TRUE
[SYMCHK] Type Info: TRUE
[SYMCHK] ------------------------------------
SymbolCheckVersion 0x00000002
Result 0x001f0001
DbgFilename
DbgTimeDateStamp 0x5d013f8e
DbgSizeOfImage 0x00232000
DbgChecksum 0x002346b1
PdbFilename c:\symbols\AppSensor.pdb\3754687F7111426692C7E697A47D734C1\AppSensor.pdb
PdbSignature {00000000-0000-0000-0000-000000000000}
PdbDbiAge 0x00000000
[SYMCHK] [ 0x00000000 - 0x001f0001 ] Checked "c:\dispsym_local_cache\bugs\AppSensor\AppSensor.dll"
SYMCHK: c:\dispsym_local_cache\bugs\AppSensor\AppSensor.dll PASSED - PDB: c:\symbols\AppSensor.pdb\3754687F7111426692C7E697A47D734C1\AppSensor.pdb DBG: <N/A>
SYMCHK: FAILED files = 0
SYMCHK: PASSED + IGNORED files = 1
>!lmi moduleName //print the moduleName's header information assuming that the module is loaded already
Example:
: kd> !lmi nvlddmkm
Loaded Module Info: [nvlddmkm]
Module: nvlddmkm
Base Address: fffff80e97690000
Image Name: nvlddmkm.sys
Machine Type: 34404 (X64)
Time Stamp: 5c7dcd42 Mon Mar 4 17:13:38 2019
Size: 14ff000
CheckSum: 149c79c
Characteristics: 22
Debug Data Dirs: Type Size VA Pointer
CODEVIEW 88, 8180d8, 815ad8 RSDS - GUID: {92644F26-333B-4C11-9CEB-B8B49D806B87}
Age: 1, Pdb: C:\dvs\p4\build\sw\rel\gpu_drv\r421\r421_00\drivers\display\lddm\nvlddmkm\_out\wddm2_amd64_release\nvlddmkm.pdb
VC_FEATURE 14, 818160, 815b60 [Data not mapped]
POGO 38c, 818174, 815b74 [Data not mapped]
Image Type: MEMORY - Image read successfully from loaded memory.
Symbol Type: NONE - PDB not found from symbol server.
Load Report: no symbols loaded
When you see windbg complains about not being able to load symbol files for certain dll files, (but you know for sure that the files are there in the symbol paths) There can only be a few reasons for this. One reason for this is the timestamp for these files are different from the one used during the creation of the dump file.
You can force windbg to load these symbol files by issuing this command
>.symopt+0x40 //this will tell windbg to load
> X module!symbol - find the address of the symbol in the module
>x myapp!*CMainFrame* // list all member functions and static data members of CMainFrame class define in myapp. you can get the address of the symbols from the output.
>ln Address //find the symbol by address
For other commands check the manual for WinDBG
Debug with visual studio -- the preferred method because visual studio has a much more advanced debugger
devenv /debugexe program.exe --- launch the program to debug. This is better than attaching to a process because sometimes it is too late to see the issue when you try to attach to the process. For example, if the process crashes right the way, then you cannot attach to it. You may need to specify the full path to the program in order for Visual Studio to locate the program.
Launching the program this way allows to you see what files get loaded. You can check the output console for errors like missing symbol files ( *.pdb) and know the path where Visual Studio (VS) is looking for these files. If VS cannot load the symbol file for a particular library, then you can step through the code in that library. From the output console, u can also right click on the library and specified the path to the symbol file as well but this will take vs sometime to load and update. It is best that you stop the session and copy the symbol files to the path VS is expecting and restart the debug session again. Notice the output console can give you valuable information. This information is similar to the information you would get from running the dependency walker program but it is more readable. What is good about this is the errors are
shown next to the questioned library files. With Dependency Walker you have to rely on the icons representing errors. If a library cannot be loaded or missing, you can tell right the way from the console where VS is looking for that library.
To set a break point, press ctrl+b and type in the method name or class::method to set a breakpoint at that method.
If you want to debug with a release build, run this command in the console first before running the devenv ... command:
set _NT_SYMBOL_PATH=SRV*c:\symbols\analytics*\\sdcnas05.siebel.com\anabuild\share\gasymsrv;SRV*c:\symbols\analytics*\\sdcnas06.siebel.com\ANABUILD\share
\gasymsrv;SRV*c:\symbols\analytics*\\sdcnas06.siebel.com\ANABUILD\share\symsrv;SRV*c:\symbols\winnt*http://msdl.microsoft.com/download/symbols
This will setup the symbol paths.
https://referencesource.microsoft.com/ -- contains source code
symchck
To see what request Windbg sends to the symbol server to locate the matching pdb file for a particular image use the symchk tool. In the example, below we can see the request windbg would send out to the symbol server to locate the Appsensor.pdb file that would match with the Appsersor.dll file. Comments on the output started with ##>symchk.exe /od /ob /op /oe /os /v /s "srv*c:\symbols*http://localhost/sym" "AppSensor.dll"
## /s specify the local directory and the symbol server address
[SYMCHK] Searching for symbols to c:\dispsym_local_cache\bugs\AppSensor\AppSensor.dll in path srv*c:\symbols*http://localhost/sym
DBGHELP: Symbol Search Path: srv*c:\symbols*http://localhost/sym
[SYMCHK] Using search path "srv*c:\symbols*http://localhost/sym"
DBGHELP: No header for c:\dispsym_local_cache\bugs\AppSensor\AppSensor.dll. Searching for image on disk
DBGHELP: c:\dispsym_local_cache\bugs\AppSensor\AppSensor.dll - OK
SYMSRV: BYINDEX: 0x1
c:\symbols*http://localhost/sym
AppSensor.pdb
3754687F7111426692C7E697A47D734C1
SYMSRV: UNC: c:\symbols\AppSensor.pdb\3754687F7111426692C7E697A47D734C1\AppSensor.pdb - path not found
SYMSRV: UNC: c:\symbols\AppSensor.pdb\3754687F7111426692C7E697A47D734C1\AppSensor.pd_ - path not found
SYMSRV: UNC: c:\symbols\AppSensor.pdb\3754687F7111426692C7E697A47D734C1\file.ptr - path not found
SYMSRV: HTTPGET: /sym/index2.txt
SYMSRV: HttpQueryInfo: 80190194 - HTTP_STATUS_NOT_FOUND
SYMSRV: HTTPGET: /sym/AppSensor.pdb/3754687F7111426692C7E697A47D734C1/AppSensor.pdb
###First, it tries to download the non compressed version of the file. The actually request or URL used
#is http://localhost/sym/AppSensor.pdb/3754687F7111426692C7E697A47D734C1/AppSensor.pdb
SYMSRV: HttpQueryInfo: 80190194 - HTTP_STATUS_NOT_FOUND
SYMSRV: HTTPGET: /sym/AppSensor.pdb/3754687F7111426692C7E697A47D734C1/AppSensor.pd_
###Second, if the first request does not work, it will try to download the compress version for the file ending with underscore.
###AppSensor.pd_
SYMSRV: HttpQueryInfo: 801900c8 - HTTP_STATUS_OK
SYMSRV: AppSensor.pdb from http://localhost/sym: 2883718 bytes copied
SYMSRV: PATH: c:\symbols\AppSensor.pdb\3754687F7111426692C7E697A47D734C1\AppSensor.pdb
###Here the file is downloaded and store at this local path.
SYMSRV: RESULT: 0x00000000
DBGHELP: AppSensor - private symbols & lines
c:\symbols\AppSensor.pdb\3754687F7111426692C7E697A47D734C1\AppSensor.pdb
###All of the info below is debug information about the image Appsensor.dll
[SYMCHK] MODULE64 Info ----------------------
[SYMCHK] Struct size: 1680 bytes
[SYMCHK] Base: 0x180000000
[SYMCHK] Image size: 2301952 bytes
[SYMCHK] Date: 0x5d013f8e
[SYMCHK] Checksum: 0x002346b1
[SYMCHK] NumSyms: 0
[SYMCHK] SymType: SymPDB
[SYMCHK] ModName: AppSensor
[SYMCHK] ImageName: c:\dispsym_local_cache\bugs\AppSensor\AppSensor.dll
[SYMCHK] LoadedImage: c:\dispsym_local_cache\bugs\AppSensor\AppSensor.dll
###Below is the PDB section information. CV stands for code view. CV=RSDS indicates it's a
### PDB 7.0 file format.
[SYMCHK] PDB: "c:\symbols\AppSensor.pdb\3754687F7111426692C7E697A47D734C1\AppSensor.pdb"
[SYMCHK] CV: RSDS
[SYMCHK] CV DWORD: 0x53445352
[SYMCHK] CV Data: C:\dvs\p4\build\sw\gcomp\dev\src\Mjolnir\Features\AppSensor\plugin\_out\win7_amd64_release\AppSensor.pdb
[SYMCHK] PDB Sig: 0
[SYMCHK] PDB7 Sig: {3754687F-7111-4266-92C7-E697A47D734C}
[SYMCHK] Age: 1
###Notice the signature of the PDB file + its age formed part of the URL mentioned earlier
###3754687F-7111-4266-92C7-E697A47D734C + 1
[SYMCHK] PDB Matched: TRUE
[SYMCHK] DBG Matched: TRUE
[SYMCHK] Line nubmers: TRUE
[SYMCHK] Global syms: TRUE
[SYMCHK] Type Info: TRUE
[SYMCHK] ------------------------------------
SymbolCheckVersion 0x00000002
Result 0x001f0001
DbgFilename
DbgTimeDateStamp 0x5d013f8e
DbgSizeOfImage 0x00232000
DbgChecksum 0x002346b1
PdbFilename c:\symbols\AppSensor.pdb\3754687F7111426692C7E697A47D734C1\AppSensor.pdb
PdbSignature {00000000-0000-0000-0000-000000000000}
PdbDbiAge 0x00000000
[SYMCHK] [ 0x00000000 - 0x001f0001 ] Checked "c:\dispsym_local_cache\bugs\AppSensor\AppSensor.dll"
SYMCHK: c:\dispsym_local_cache\bugs\AppSensor\AppSensor.dll PASSED - PDB: c:\symbols\AppSensor.pdb\3754687F7111426692C7E697A47D734C1\AppSensor.pdb DBG: <N/A>
SYMCHK: FAILED files = 0
SYMCHK: PASSED + IGNORED files = 1
Setting up your own symbol server
Example:
>"C:\Program Files (x86)\Windows Kits\10\Debuggers\x64\symstore.exe" add /r /compress /t "PremierPro" /v "14.0.571" /p /l /f "D:\bugs\4220176\ppro14.0_571.debug\*.*" /s \\nquach-wx-1\symbols\
Finding ID... 0000000001
SYMSTORE: Number of pointers stored = 2139
SYMSTORE: Number of errors = 0
SYMSTORE: Number of pointers ignored = 9446
Here we create a symbol server locally. All the symbols in the given folder (/f) are indexed as pointers (/p) to the original Files in the given path. /r search recursively
/t product name
/v version
The transaction id is 0000000001. This will be useful when we search and delete a transaction.
After this, you can change the symbol path to add your new symbol server at \\nquach-wx-1\symbols. You can see all the files added to \\nquach-wx-1\symbols if you have it empty earlier.
You need to set _NT_SYMBOL_PATH to this path so that you can run symchk.exe in any dos console.
Srv*c:\symbols*\\nquach-wx-1\symbols*srv*http://dvasymbols.corp.adobe.com*https://msdl.microsoft.com/download/
To delete the transaction and all the symbols related to it from the symstore run the command with del:
>symstore del /i 0000000001 /s \\nquach-wx-1\symbols
This command basically enables the slow loader snap in the registry allowing VS to print more useful information. Here is an example of how the output would look like after running the command above:
27014:272ec @ 429100578 - LdrpProcessWork - ERROR: Unable to load DLL: "MSVCR100.dll", Parent Module: "c:\moduleA.dll", Status: 0xc00000ba
27014:272ec @ 429100578 - LdrpInitializeProcess - ERROR: Walking the import tables of the executable and its static imports failed with status 0xc00000ba
27014:272ec @ 429100578 - _LdrpInitialize - ERROR: Process initialization failed with status 0xc00000ba
27014:272ec @ 429100578 - LdrpInitializationFailure - ERROR: Process initialization failed with status 0xc00000ba
Here moduleA.dll is the one that fails to load so it needs to fixed or be replaced.
https://stackoverflow.com/questions/36315538/how-to-determine-which-dll-dependency-is-failing-to-load-in-windows-store-univer
Find Dependencies using dumpbin
C:\Program Files (x86)\Microsoft Visual Studio\2017\Enterprise>dumpbin /dependents S:\...\Win\Debug\64\mp4decoder_dll.dll Microsoft (R) COFF/PE Dumper Version 14.16.27030.1 Copyright (C) Microsoft Corporation.All rights reserved. Dump of file S:\...\Win\Debug\64\mp4decoder_dll.dll File Type: DLL Image has the following dependencies: KERNEL32.dll MSVCP100.dll MSVCR100.dll Summary D000 .data 15000 .data1 8000 .pdata 1D000 .rdata 2000 .reloc 1000 .rsrc AD000 .text 1000 .tls
On Macs, the crash logs are stored in
. Those will be copied to the
folder.
~/Library/Logs/DiagnosticReports
working
On Windows, crash logs won't be stored by default. The "Dr. Watson" replacement in Vista, "Windows Error Reporting" (WER), sends out an e-
mail with the data to Microsoft. In order to store the files locally, you need to enable it via the Vista registry:
Save the following text to a file named wer.reg:
Windows Registry Editor Version 5.00
[HKEY_LOCAL_MACHINE\SOFTWARE\Microsoft\Windows\Windows Error Reporting]
"ForceQueue"=dword:00000001
Double-click the file from Windows Explorer and respond affirmatively to any prompts. Reboot.
The next time Premiere Pro or any component crashes, the crash information will be written into a folder located inside
%LOCALAPPDATA%
. Check the modification date to make sure you are using the correct file.
MicrosoftWindowsWERReportQueue
Those are the files that will be stored by WER:
WERxxxx.tmp.mdmp
}: This is the most important file. It contains the crash dump that can be opened inside Visual Studio or other
Windows debuggers.
WERxxxx.tmp.version.txt
: Contains the operating system version and other hardware information.
WERxxxx.tmp.appcompat.txt
: Lists all of the DLLs loaded at the time of the crash with their version information
Getting Crash Logs
On Macs, the crash logs are stored in ~/Library/Logs/DiagnosticReports. Those will be copied to the working folder.
On Windows, crash logs won't be stored by default. The
"Dr. Watson" replacement in Vista, "Windows Error
Reporting" (WER), sends out an e-mail with the data to Microsoft. In order to store the files
locally, you need to enable it via the Vista registry:Save the following text to a file named wer.reg:
Windows Registry Editor Version 5.00
HKEY_LOCAL_MACHINE\SOFTWARE\Microsoft\Windows\Windows Error
Reporting]
"ForceQueue"=dword:00000001
Double-click the file from Windows Explorer and respond
affirmatively to any prompts. Reboot.
The next time Premiere Pro or any component crashes, the
crash information will be written into a folder located inside
%LOCALAPPDATA%
Those are the files that will be stored by WER:
- WERxxxx.tmp.mdmp }: This is the most important file. It contains the crash dump that can be opened inside Visual Studio or other Windows debuggers.
- WERxxxx.tmp.version.txt: Contains the operating system version and other hardware information.
- WERxxxx.tmp.appcompat.txt: Lists all of the DLLs loaded at the time of the crash with their version information.
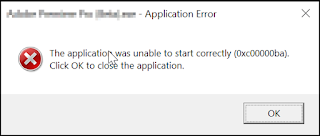
Application failed to start
Sometimes the application fails to start and pops up a dialog like the one below. Clicking on the ok button, the application closed. The first thing to do is open the event viewer program in Windows and search for the application name in the application logs section. This may help tell you what's the exactly problem or what module is failing to load during the start up.

If the event viewer fails to give any meaningful information, the next step is to run the application inside Visual Studio. Visual Studio would print more information regarding to what modules get loaded and etc. If this fails to provide any more meaningful information, then run this command in the DOS console and re-run the programA.exe in Visual Studio:
>gflags -i "ProgramA.exe" +sls
This command basically enables the slow loader snap in the registry allowing VS to print more useful information. Here is an example of how the output would look like after running the command above:
27014:272ec @ 429100578 - LdrpProcessWork - ERROR: Unable to load DLL: "MSVCR100.dll", Parent Module: "c:\moduleA.dll", Status: 0xc00000ba
27014:272ec @ 429100578 - LdrpInitializeProcess - ERROR: Walking the import tables of the executable and its static imports failed with status 0xc00000ba
27014:272ec @ 429100578 - _LdrpInitialize - ERROR: Process initialization failed with status 0xc00000ba
27014:272ec @ 429100578 - LdrpInitializationFailure - ERROR: Process initialization failed with status 0xc00000ba
Here moduleA.dll is the one that fails to load so it needs to fixed or be replaced.
https://stackoverflow.com/questions/36315538/how-to-determine-which-dll-dependency-is-failing-to-load-in-windows-store-univer
How to know where in the code does it open or do a file operation?
If you want to see the stack trace of the program when it is doing file operations, just set a break point to any of the file API in Visual Studio:
GetFullPathNameA for ansi
GetFullPathNameW for unicode
ReadFile
WriteFileW
GetTempPathW -- handy if the program is trying to access a temp folder
All these methods are defined in the kernel32.dll.
How to set conditional breakpoints?
string comparison in VS studio. Here thePath is a UTF16String or a wchar*:
wcscmp(&thePath[0], L"Peak Files") == 0
wcscmp(&thePath[0], L"\\\\?\\C:\\Users\\Nquach\\AppData\\Roaming\\Adobe") == 0
thePath.c_str() == L"Peak Files" won't work
set breakpoint if variable or thePath contains the given substring:
wcsstr(&thePath[0],L"Peak Files") != nullptr
More advance breakpoint set in assembly code:
Here rcx is a register known to contain the first parameter value or a string of the function you try to debug but have no source code. You can set this conditional breakpoint in the assembly code.
wcsstr((wchar_t*)rcx, L"Peak Files") != nullptr
You need to step into the method you are trying to break to see its assembly code and then add the breakpoint at the assembly line interested.
How to view value in the registers?
Let say you wan to know where in the code that is trying to create a folder. The first thing to do is to set a breakpoint at the system level method that tries to create the folder. If you are setting a breakpoint at a system call like CreateDirectoryW, and you want to view the value of the first argument to this method, you can examine the assembly code of this method to see what is the register name containing the value of the first argument. Once the breakpoint is hit, step into it so we can see the assembly code of this method. The first few lines will try to retrieve the value of the input parameters. Usually the first parameter is 8 bytes from the base pointer or it came from an expression similar to this
>mov ... [register1 + 8 ], register2 or
> mov qword ptr [rsp+8],rcx
register1/rsp is the base pointer to the function stack frame.
Here register2/rcx will contain the value of the first parameter. Looking at the documentation of CreateDirectoryW we know that the first argument is a wchar_t*.
If you put (wchar_t*)rcx into the watch window, we will see the string value of the first argument.
If the first argument is a char* instead, we will put (char*)(rcx) into the watch window.
With this information you can set a breakpoint based on the value of the register with an expression like this:
wcsstr((wchar_t*)rcx, L"Peak Files") != nullptr
This is really cool since you don't have the source code of CreateDirectoryW.
Check this link for more information about the 64 bit registers and their usage:
GetLastError and all error code value meaning can be seen here
No comments:
Post a Comment